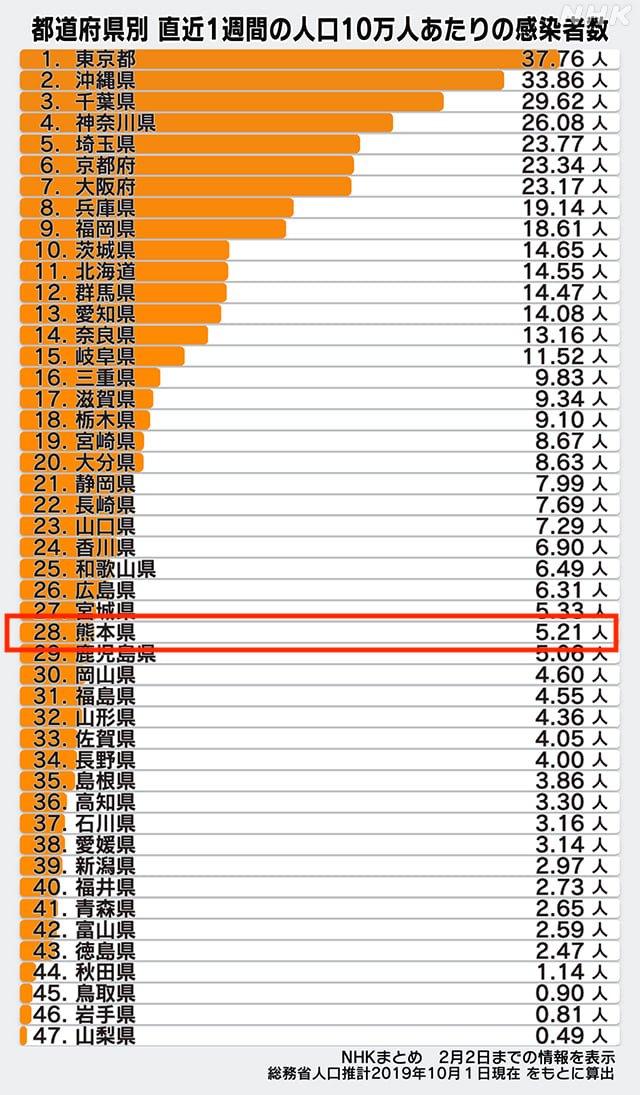
When we see the daily numbers of people who have gotten COVID-19 by prefecture, it's hard to know how to compare them. Sure, Tokyo should have bigger numbers becasue Tokyo's population is huge, right? That's true but, even when taking the population into account, the numbers in Tokyo have been much higher than here in Kumamoto. This graph is from the following page, and seems to be updated daily:
https://www3.nhk.or.jp/news/special/coronavirus/data/#latest-weeks-card
It indicates the number of people per 100,000 who became infected during the past week. The numbers for Kumamoto check out with other sources. We've had a total of 91 infections in the last week (down from previous weeks) and the population of the prefecture is about 1,748,000. That's 91 / 17.48 = about 5.2 or so.
Now, comparing these rates with other countries can be tricky because different sites calculate the averages differently.
After having some difficulty finding a good site with comparable data, I finally settled on the following page:
https://www.statista.com/statistics/1104709/coronavirus-deaths-worldwide-per-million-inhabitants/
You can get the number of cases in the past 7 days and the population. The numbers check out for Japan, where the average for the country as a whole works out to be about 14 (Kumamoto is much better at about 5). The USA is about 254.42 per 100,000 per week -- still quite high. New Zealand, on the other and is about 0.14 so Kumamoto still has a long way to go to get to that level. But, as an American, I feel pretty good about waiting out the pandemic here in Kumamoto. ;)
-- Kirk