Kirk with a link to the hazard map I promised yesterday:
https://disaportal.gsi.go.jp/maps/
The URL for yesterday's post, in case you missed it:
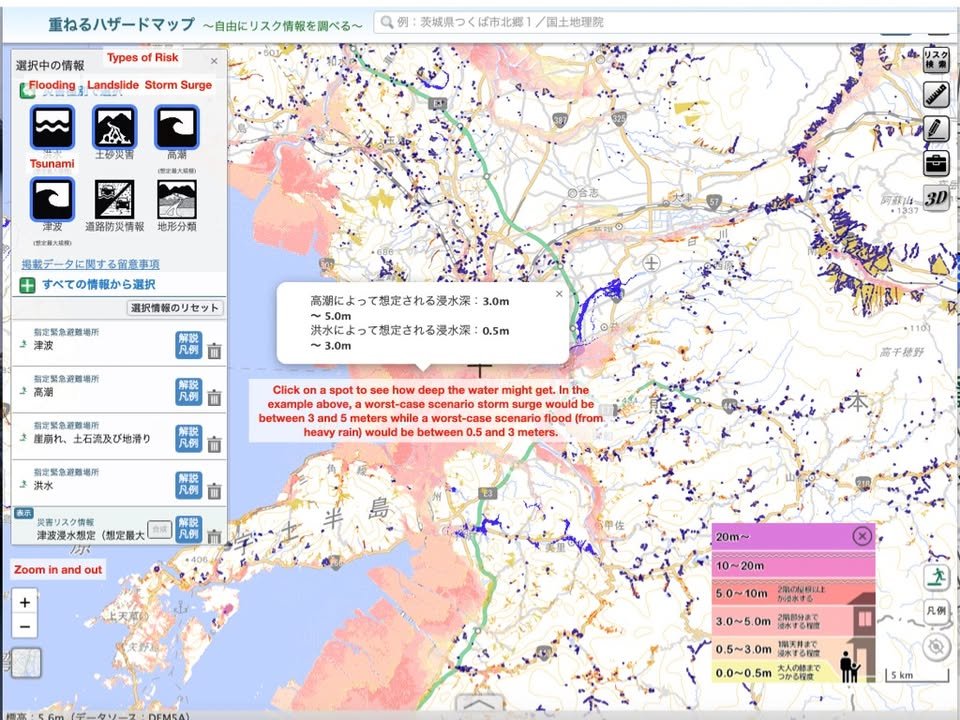
I think this is the best hazard map interface I've seen so far. You can choose one type of risk (flood, landslide, storm surge, etc.) and display that separately or choose several to display simultaneously (overlapping) as in the example image I have made for this post. As far as I can tell, the projected depths of water are worst-case scenarios but I couldn't find an explanation of whether that is once in a hundred years or what. I did find a note indicating that, in extreme circumstances, depths might be even greater than those projected.
I hope this will help you decide whether or not you are in a area that is risky enough to warrant moving to another location when evacuation "orders" are issued. Please check out your situation before you forget so that you don't need to look for the link to the hazard map in an emergency.