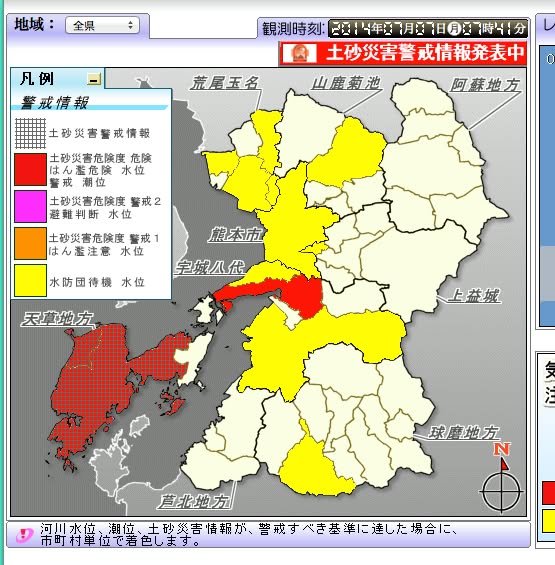
I won't try to explain what each of the colors and the chicken wire mesh at the top mean in detail because, frankly, the prefecture's explanation doesn't make a lot of sense to me. I can say two things, however. Red is the worst level and it means either that rivers have reached flooding level (or perhaps are already overflowing) or that there's a danger of landslides or both (both are listed as meanings in the key so this too is confusing). Places with chicken-wire mesh over the red have been told to evacuate (though the Japanese explanation does not state this clearly).
A good information science specialist needs to help the prefecture fix their system. The national government's system also has serious problems, such as putting out emergency information in pdf files that must be clicked upon. Still, one positive thing I can say about the prefecture's map is that it does give you a general idea of where the situation is the worse.