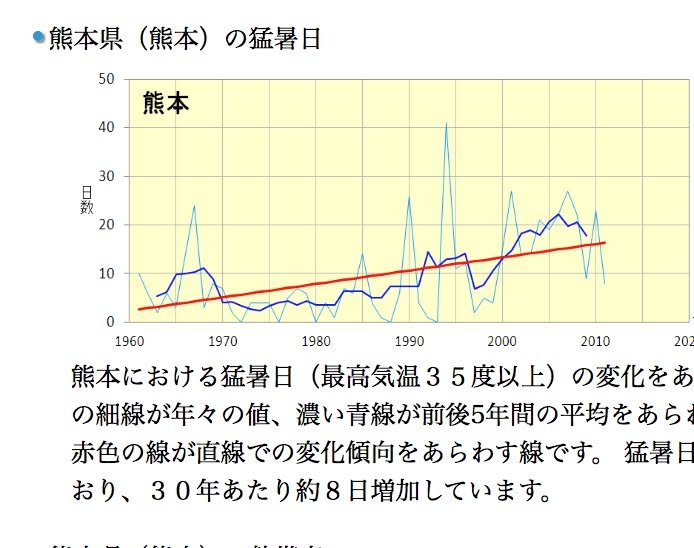
This year, records have been set all over Japan (including Kumamoto, of course) for the number of days over 35 C (95 F). I'll write more about that later but this graph helps to put the information in historical context. The light blue (somewhat faint) line represents the number of days over 35 C in each year. The dark blue line represents the 10-year average (5 years before and 5 after) for each year. The red line shows the overall trend. This data from the JMA (Japan Meteorological Agency) is presented as evidence of global warming.
The graph does not include this year's data. We won't know for another month or so what the 2016 figure for moshobi (days over 35 C) will be. Even if we don't surpass it, I suspect we will be close to the peak you see around 1998.
-- Kirk
熊本における猛暑日(最高気温35度以上)の変化をあらわしたグラフです。青の細線が年々の値、濃い青線が前後5年間の平均をあらわしています。
赤色の線が直線での変化傾向をあらわす線です。 猛暑日は熊本で有意に増加しており、30年あたり約8日増加しています。